
Patterns: how your money really moves
Your best and toughest months, your highs and dips, which categories are steady, and where your net worth could be heading.
By looking at your net worth over several months you can start identifying patterns. Whole now makes that easier for you with the new Patterns tab in Charts. It’s part of Premium.
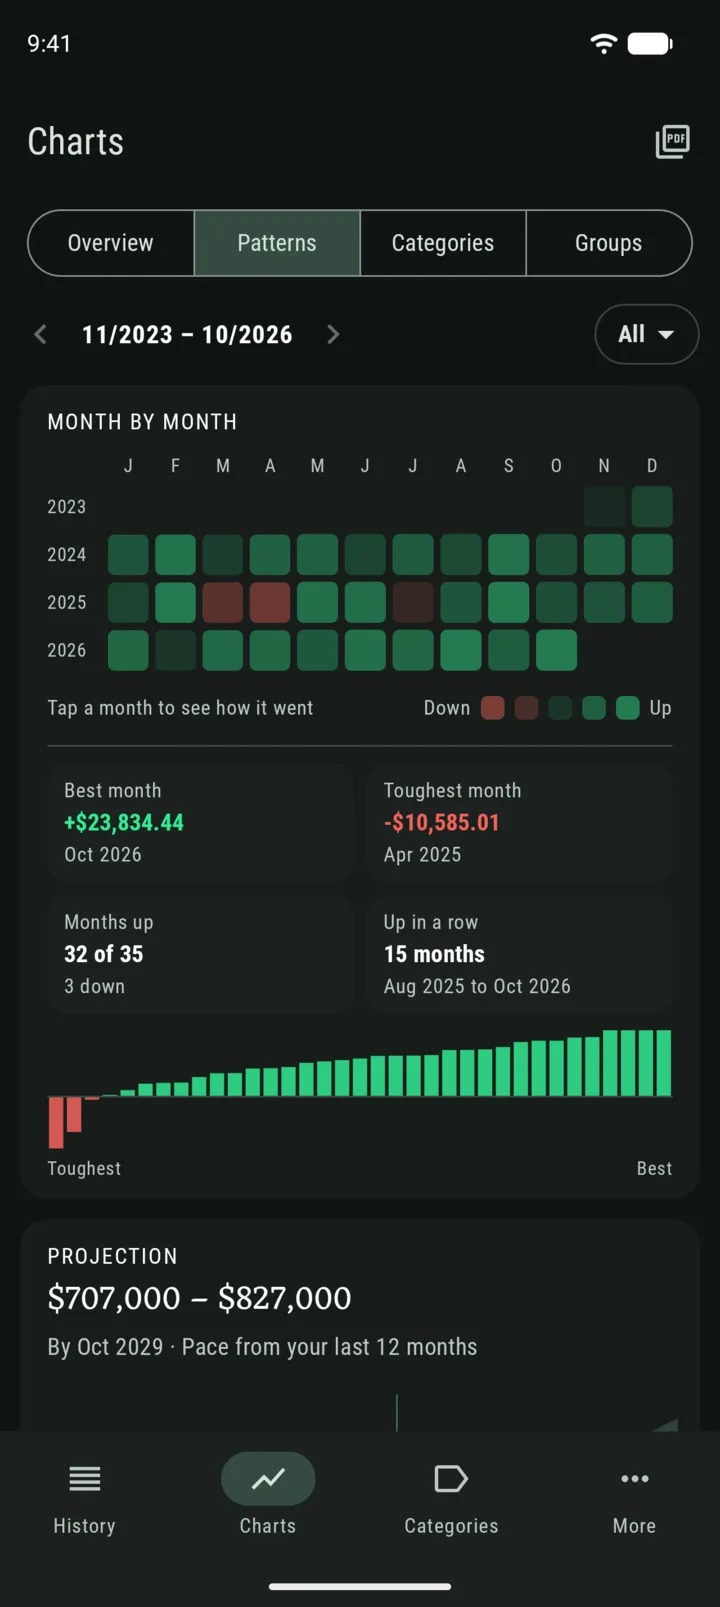
Month by month
Every month at a glance, marked up, down or not logged. Whole points out your best month, your toughest one, how many months went up, and your longest run of good ones.
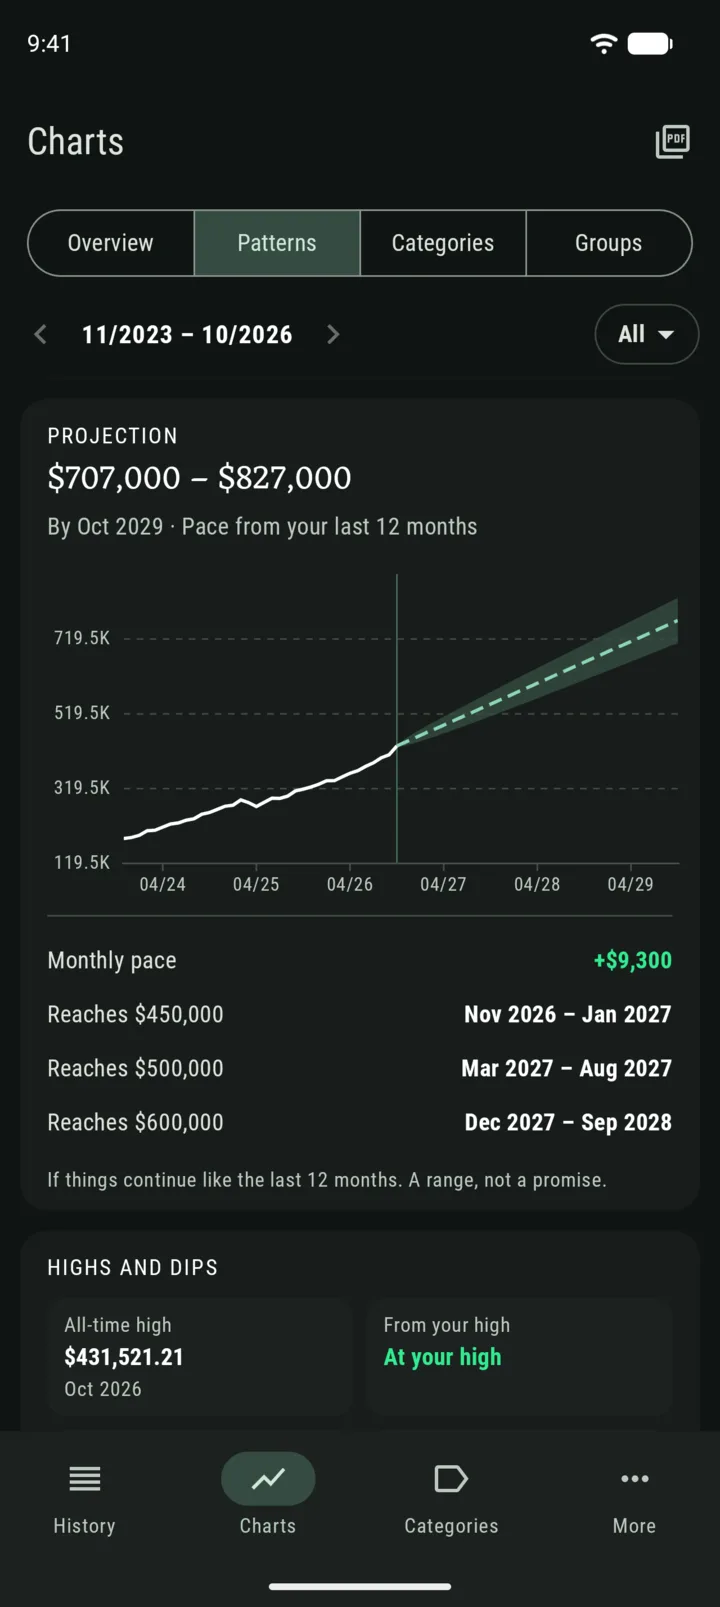
Where it’s heading
The projection takes your pace from the last 12 months and draws where your net worth could be if things keep going the same way. It shows an approximate range rather than a single line, because the future is always uncertain. The less steady your past months, the wider the range.
You’ll also see your monthly pace and when you could reach the next milestone.
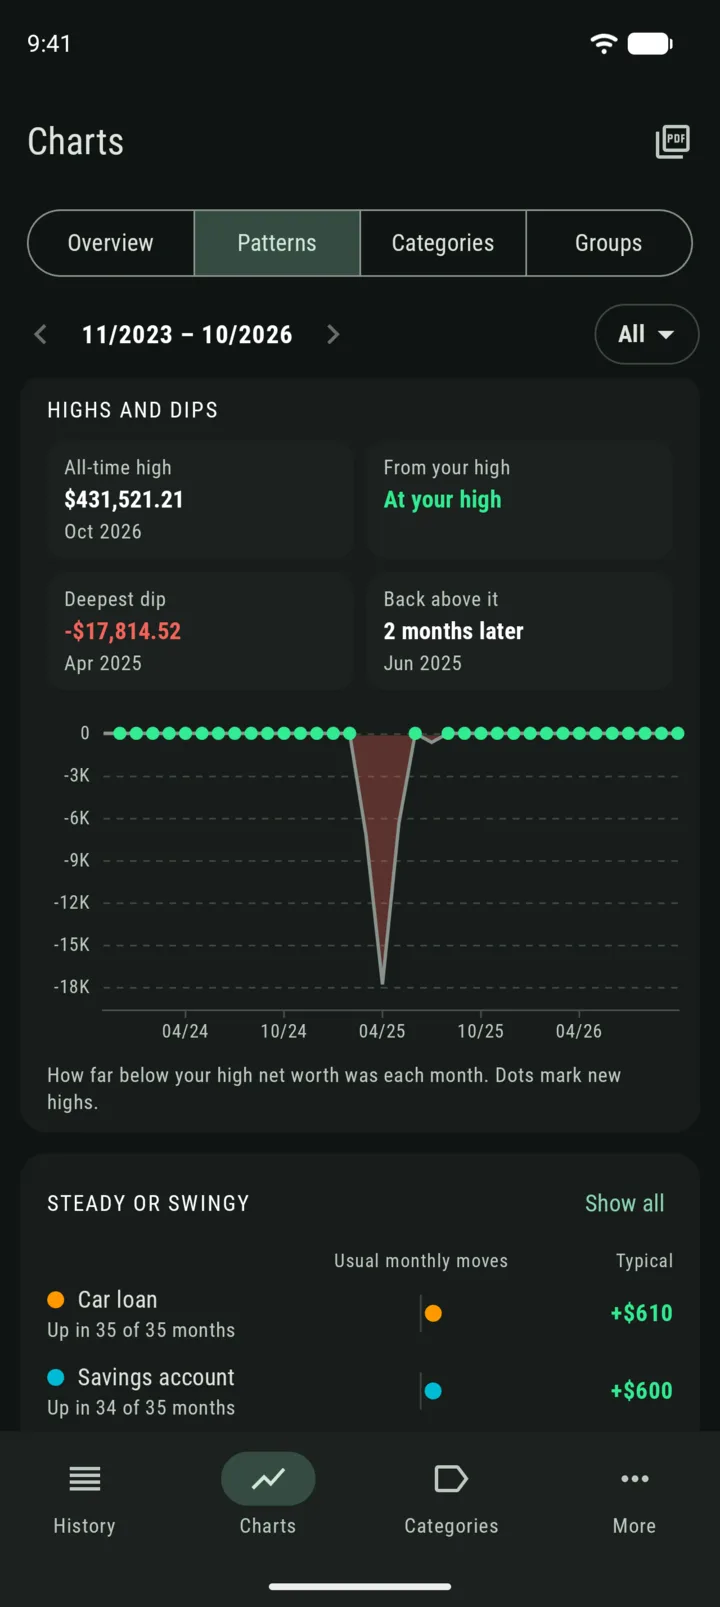
Highs and dips
When was your all-time high, and how far are you from it today? What was your deepest dip, and how many months did it take to climb back? This chart answers both.
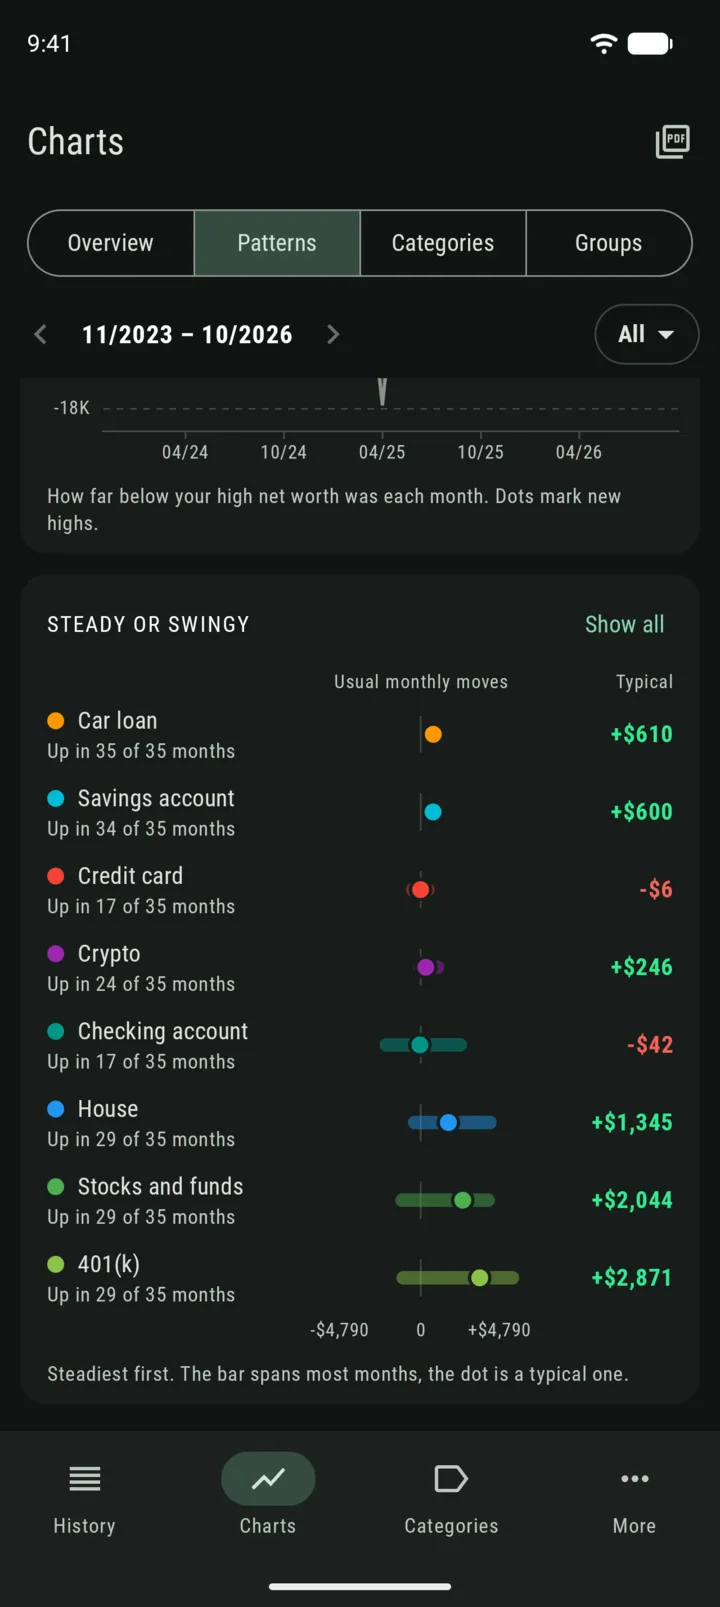
Steady or swingy
Some categories barely move. Others jump around every month (gotta love the good ol’ variance). This card shows each category’s usual monthly effect on your net worth, steadiest first.
Patterns needs a few months of records to work with. The projection, for example, needs at least 6 of the last 12 months.
— Gianmarco