
Charts that tell you why
Redesigned charts show what moved your net worth, not just where it went. Plus a light theme and proper layouts for tablets.
A line going up or down tells you what happened. It doesn’t tell you why. The new charts do.
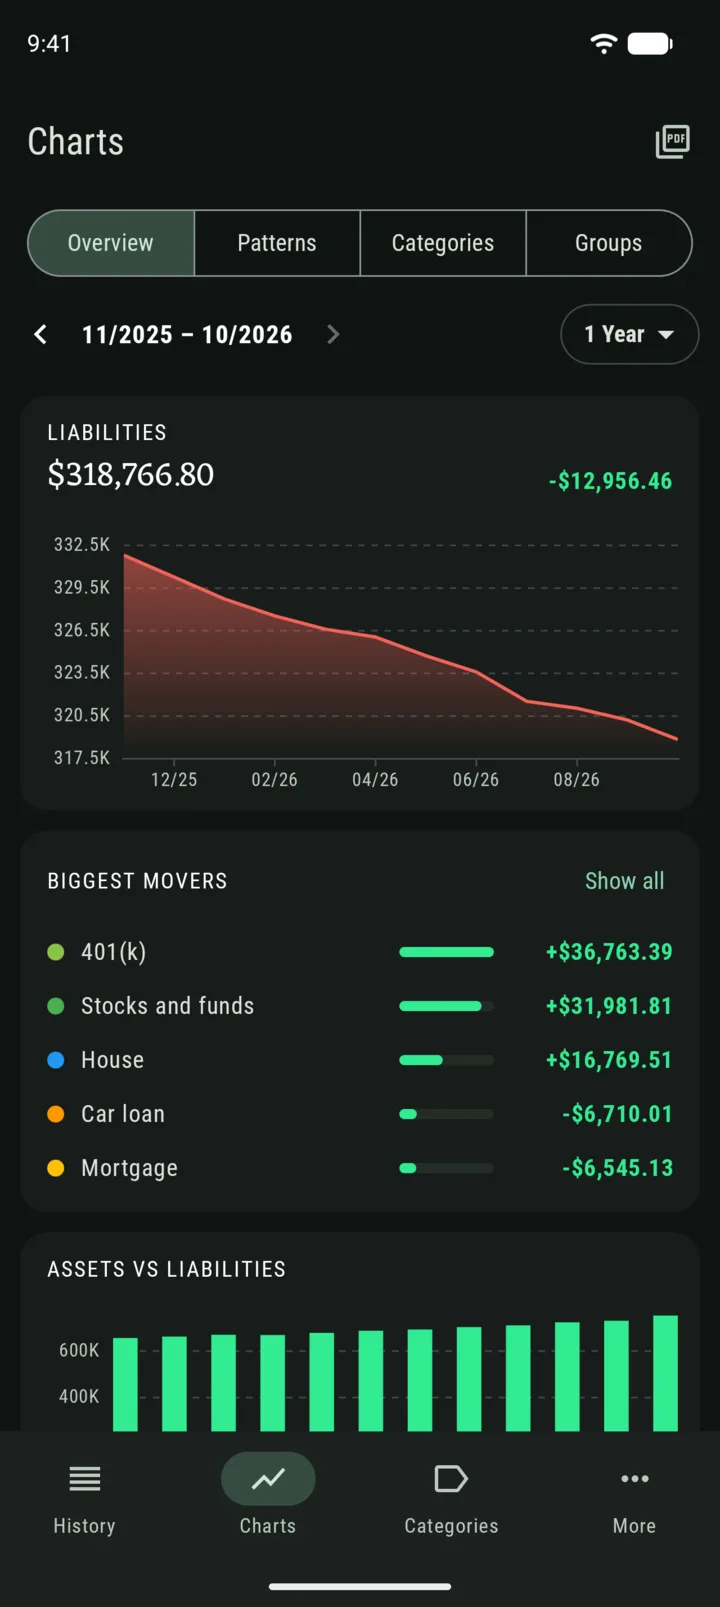
Your biggest movers
The Overview tab now lists the categories that changed the most in the period you’re looking at. Colors follow what each change did to your net worth, so a mortgage going down shows up as good news, as you would expect.
Overview is free for everyone.
Where your net worth came from
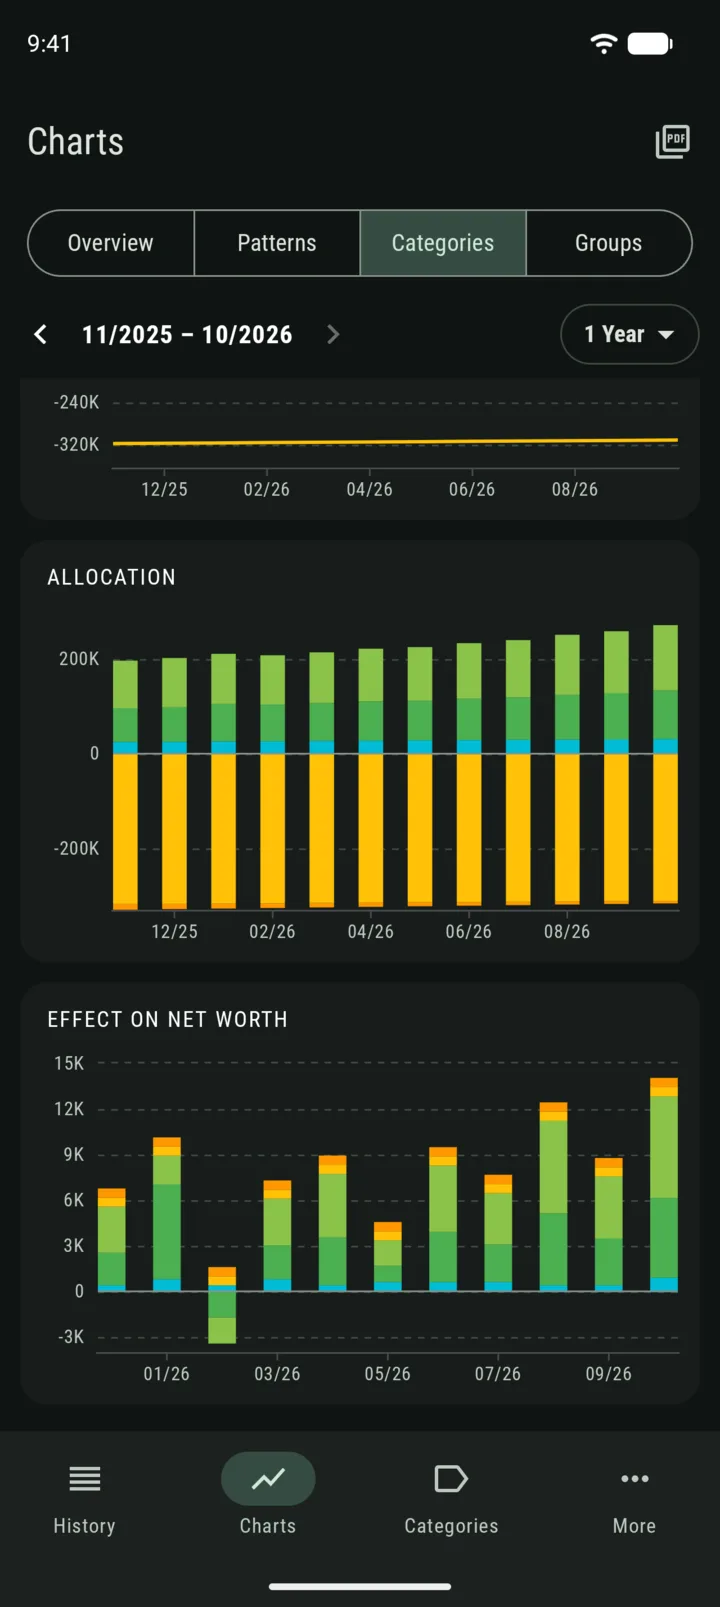
With Premium, the Categories and Groups tabs show three charts for any mix you pick:
- Trend comparison: how they moved side by side.
- Allocation: how your money is split between them.
- Effect on net worth: how much each one added or took away, period by period. Together the bars add up to your total change.
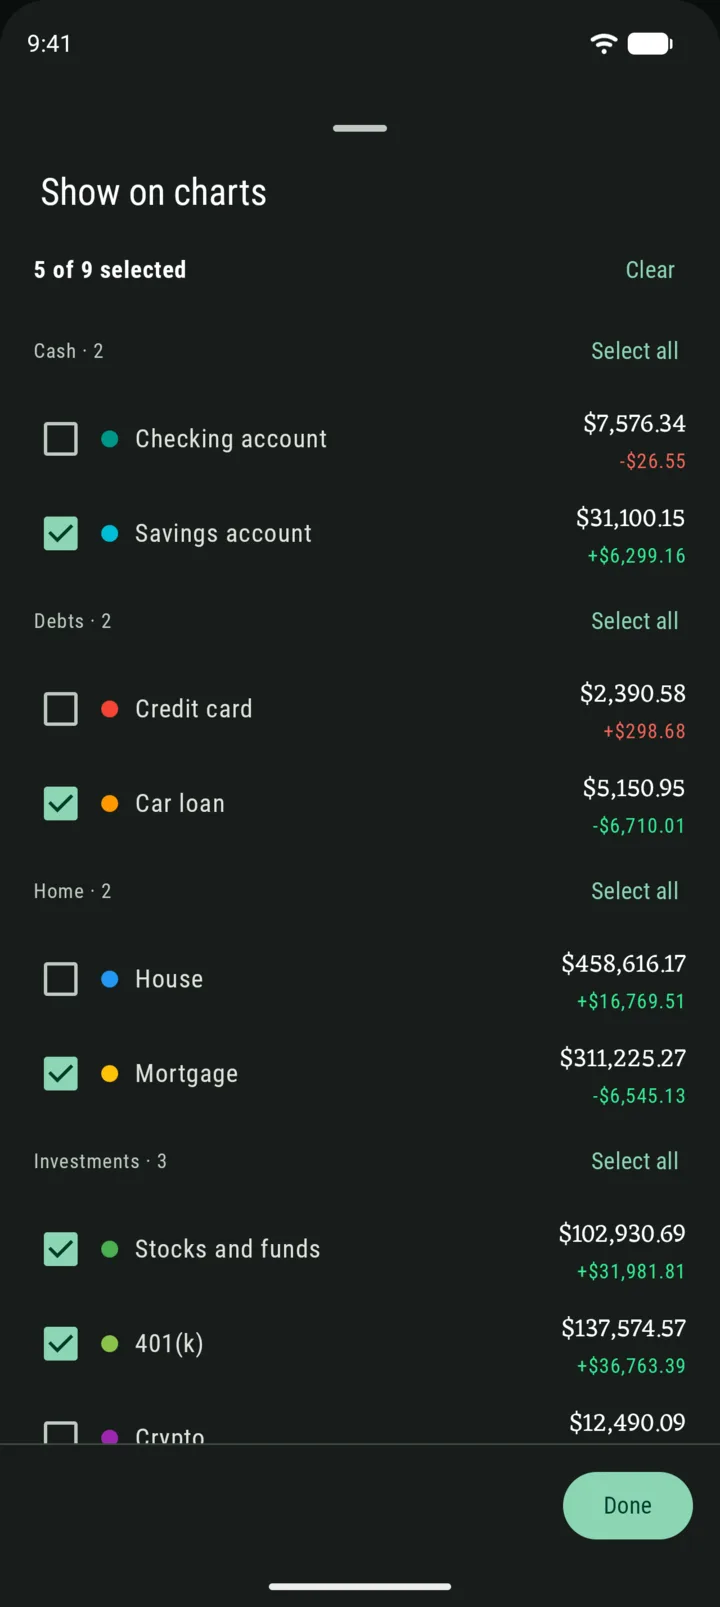
Choose what to show with a simple list: tick what you want, or select all and untick the rest.
A light theme
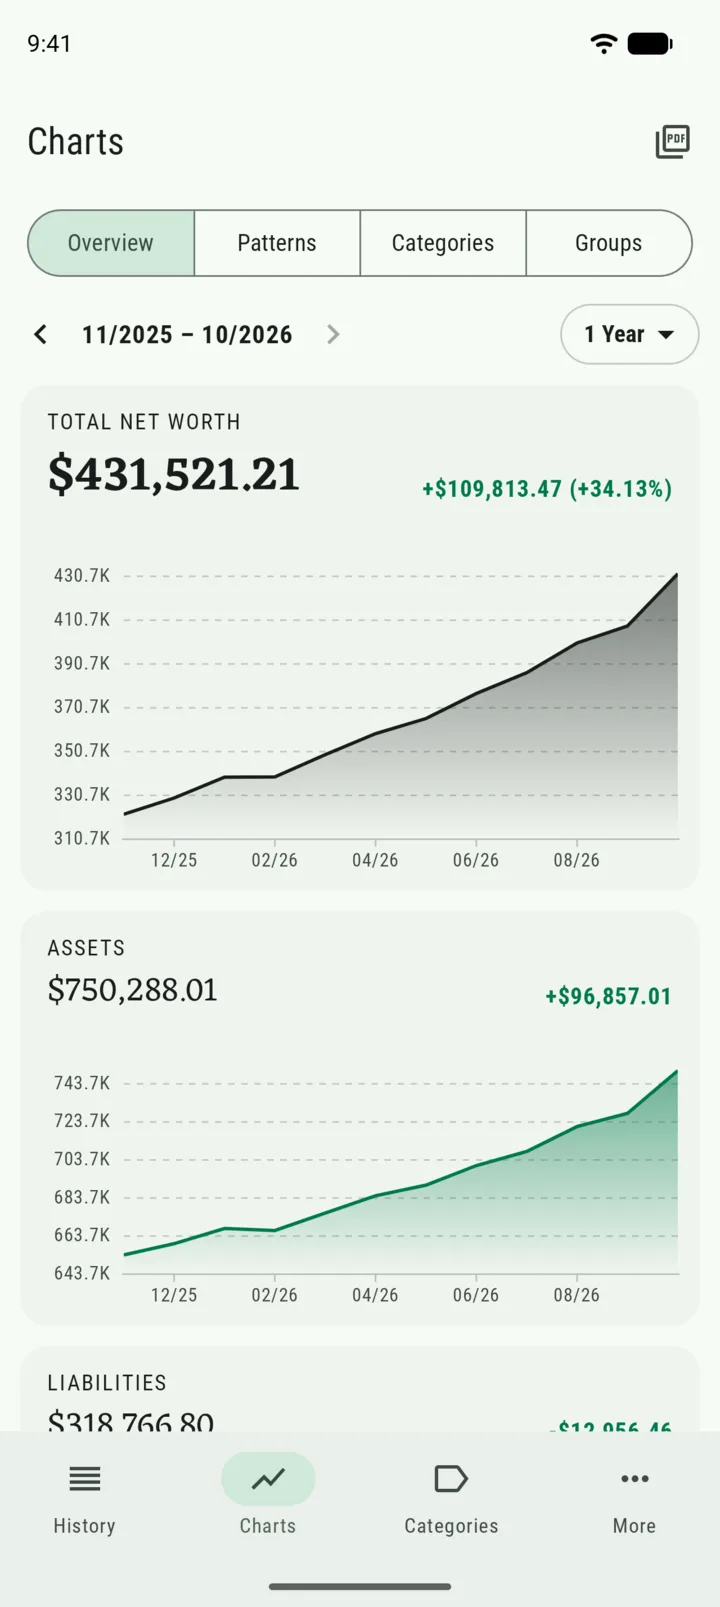
Whole was dark only. Now you can pick Light, Dark or follow your phone’s setting. A gift to all the users who love light themes.
Made for bigger screens
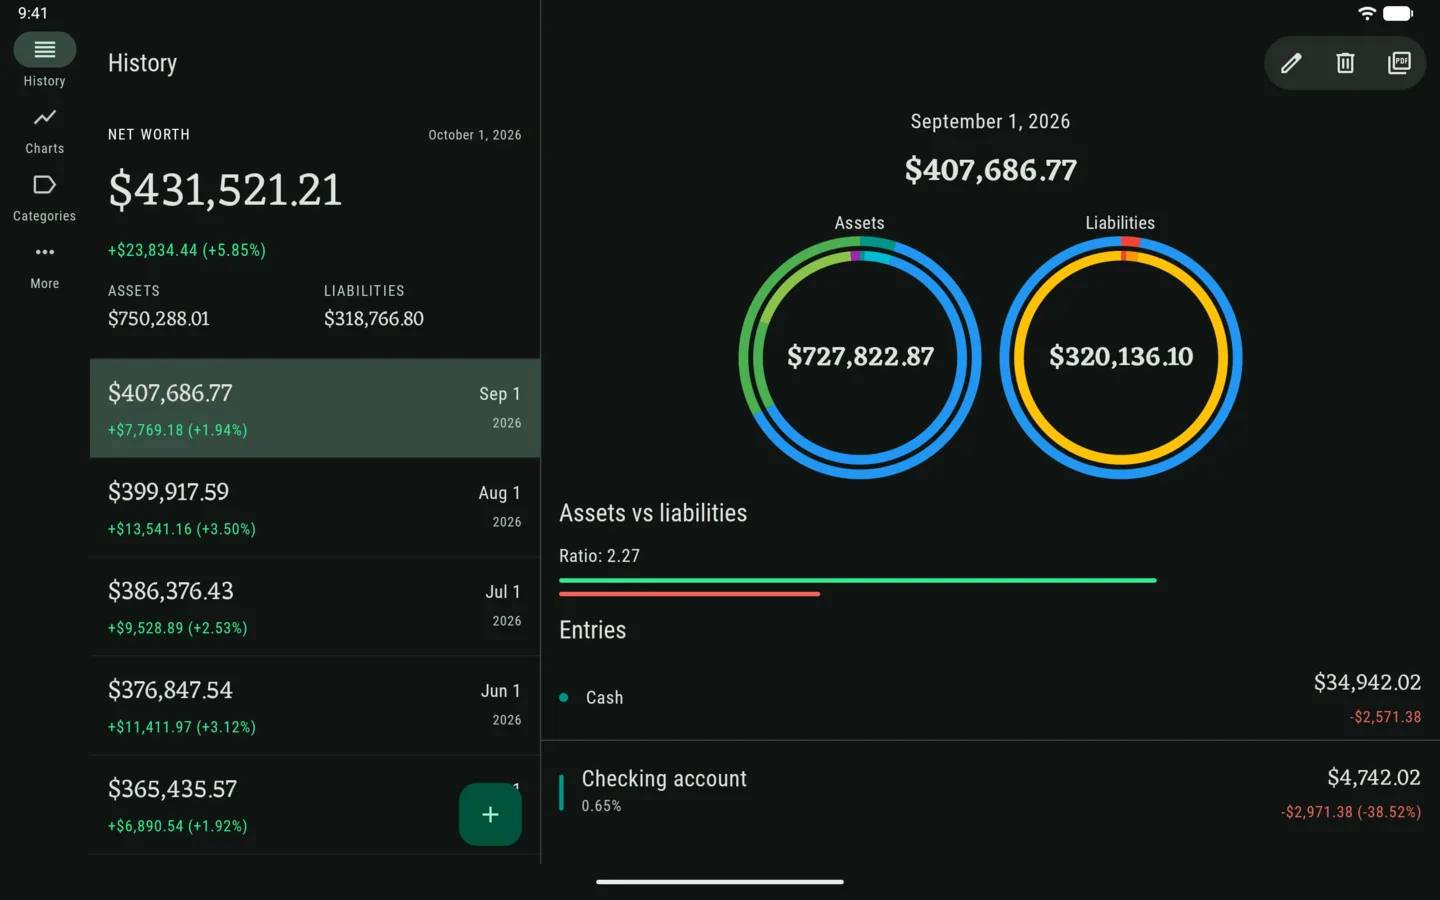
Whole is now much better optimized for bigger screens, like tablets and foldables:
- The tabs move to a rail on the side, out of your content’s way.
- History shows your records and the one you picked side by side.
- Charts sit next to each other instead of in one long column, and the category picker stays open in a side panel.
- Fold or unfold your phone and you stay right where you were.
— Gianmarco